
Role of Trend Line Analysis
Trend Line is a very much well-known tool in technical analysis for both confirmation and trend identification. In order words, a trend line can help traders identify selling and buying opportunities that exist within a strong trend. It is a straight line that connects at least two or more price points and then extends into the future to act as a resistance or line of support. A trend line is very important for a trader because there are more traders using them as support or resistance. Never try to force a trend line to fit – if a trendline doesn’t fit the candlesticks chart then it is of no use to draw it on your chart as it will only misguide you. Most of the principles applied to resistance and support levels can be applicable to trend lines as well. Let’s first read all of the concepts presented in our resistance and support before we move ahead.
RESISTANCE
Resistance is a level which ceases the price from moving upwards. The level where traders expect maximum supply (in terms of selling) for the index/stock is said to be resistance level.
Let’s say that you are analyzing the price history of the price of shares in the General Electric with the ticker symbol GE, and want to determine a time when it would be smartest to short the company. Over the past twelve months, the stock has traded between $9 and $12 per share. During the second month of the period you’re studying GE, the stock climbs to $12, but by month 2 it has fallen to $9. By month 6, it climbs again to $12, before falling to $9 in month 8. By month 10 it climbs once again to $12 and over the next 30 days, it falls to $10 before climbing again to $12. At this point, you have clearly established a resistance level of $12. 3 before climbing again to $36. At this point, you have clearly established a support level of $30. Being a trader if you see no reason for the share to break out of the band which has been trading in over the past months, this would be a great opportunity to buy the share.
SUPPORT LEVEL
Understanding the support level is not much difficult. The support is level that stops the price from moving downwards. In other words, the level where the traders expect maximum demand ( in terms of buying) is known as the support level. As soon as the price dips below the support line, it is likely to bounce back. The current price is always above the support level. Let’s say that you are analyzing the price history of the price of shares in the Apache Corporation with the ticker symbol APA, and want to determine a time when it would be smartest to short the company. Over the past twelve months, the stock has traded between $30 and $36 per share. During the second month of the period you’re studying APA, the stock climbs to $36, but by month 2 it has fallen to $30. By month 6, it climbs again to $36, before falling to $30 in month 8. By month 10 it climbs once again to $36 and over the next 30 days, it falls to $33 before climbing again to $36. At this point, you have clearly established a support level of $30. Being a trader if you see no reason for the share to break out of the band which has been trading in over the past months, this would be a great opportunity to sell the share.
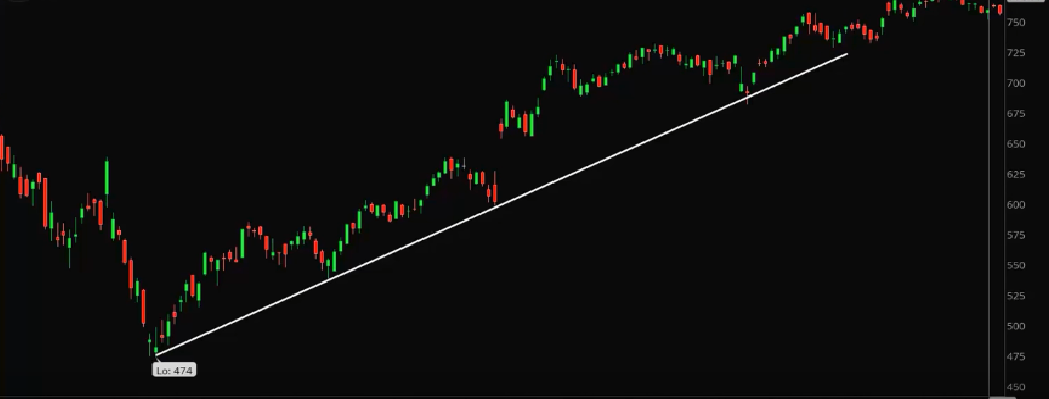
UPTREND LINE
- In an uptrend, trend lines are drawn below the price.
- Uptrend line acts as a support and tells us that there is more demand over supply, even as the price rises.
- In order to make a trend line in an uptrend, at least two lows must be attached by a straight line.
- The more and more the price touches the uptrend line, the more valid it is.
- A break below the uptrend line tells that net-demand has weakened and the trend will change soon.

DOWNTREND LINE
- In a downtrend, trend lines are drawn above the price.
- Downtrend line acts as resistance and tells us that there is more supply over demand, even as the price falls.
- In order to make a trend line in a downtrend, at least two highs must be attached by a straight line
- The more and more the price touches the downtrend line, the more valid it is.
- A break above the downtrend line tells that a change in trend could be imminent.
CONCLUSION:
Using trend lines is one of the few easy and important techniques that really work because the market respects a trend line. Drawing good trend lines is the MOST REWARDING skill, however, the problem is, one may experience, too many false breakouts. A trendline can be drawn easily on every chart, however, it is not relevant to draw a trendline on a weak trend. You have to distinguish between WEAK and STRONG trend lines. One good guideline is that a robust trend line must have at least three touching points. Trend lines with more than three touching points are monster trend lines and trader must be always ready for the vast breakout! Using trend line analysis and a trend is a very important part of a technical analysis, but don’t forget that it is only one of the many techniques and tools available. As soon as a trend line is broken it should consider as a warning that the trend is going to change very soon. It is highly recommended that when a trend line is broken you should use additional signals and tools to predict the change in trend.

